Aqua Advisor
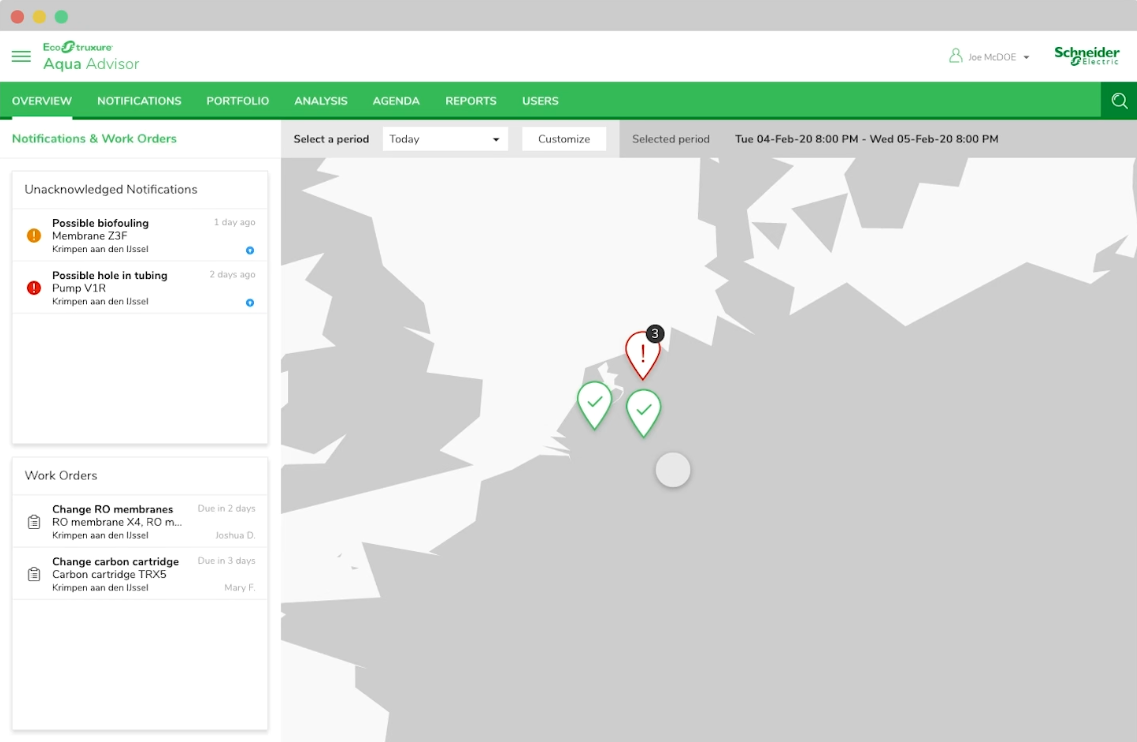
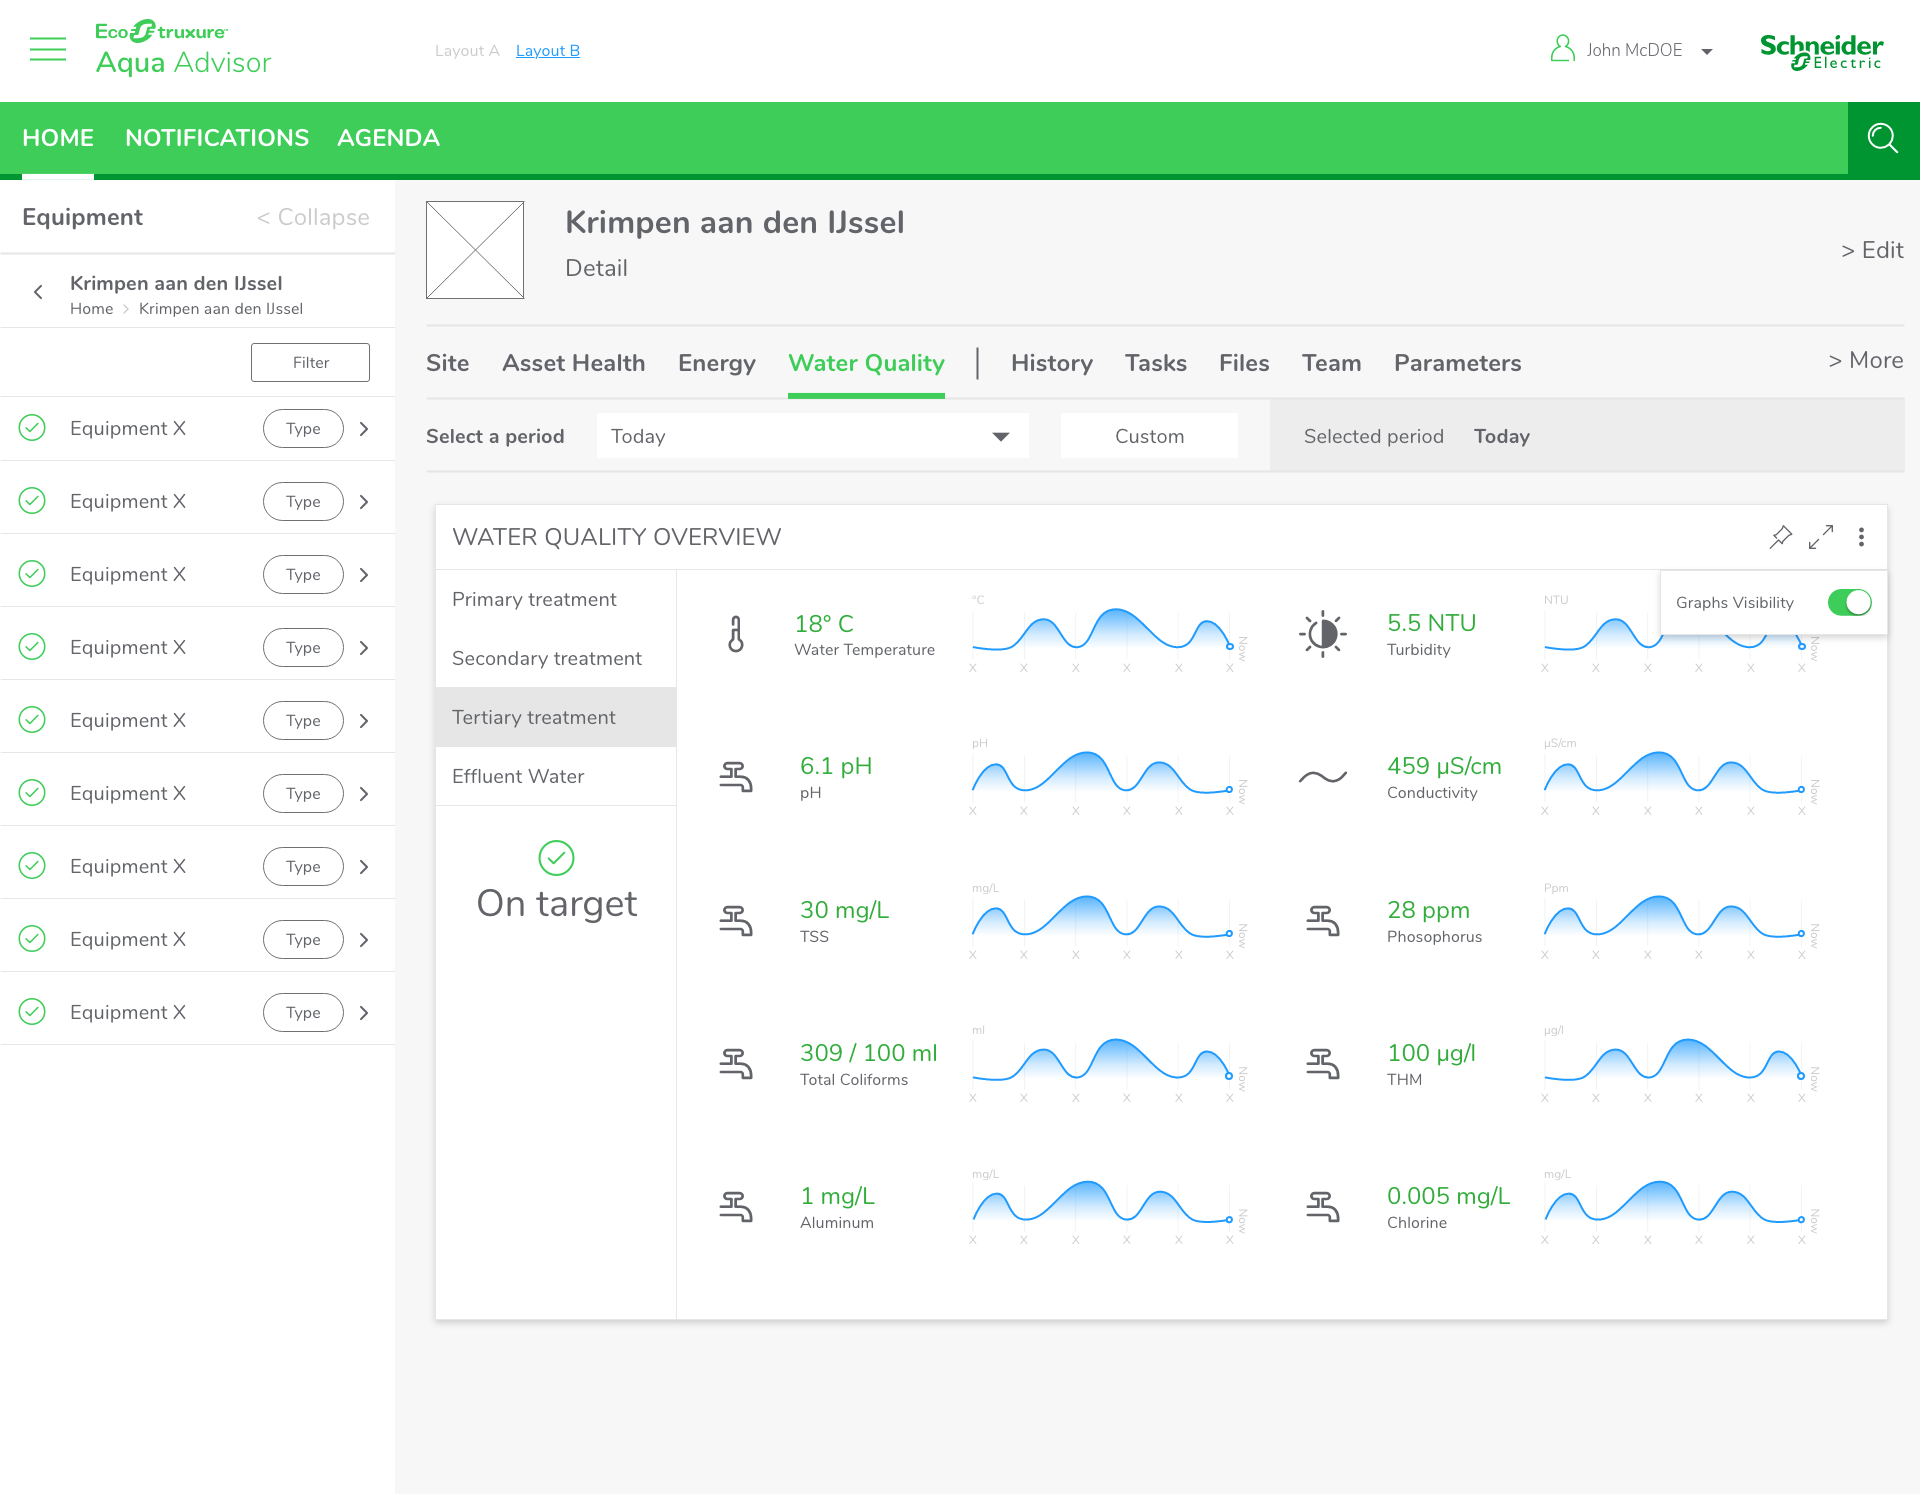
Advisory tooling for water treatment operators, translating plant sensor data into recommended actions. Built on the same modular practice and component system established for Energy Hub.
Start with this video produced and narrated by Mø ➔
The work
1. Roadmap
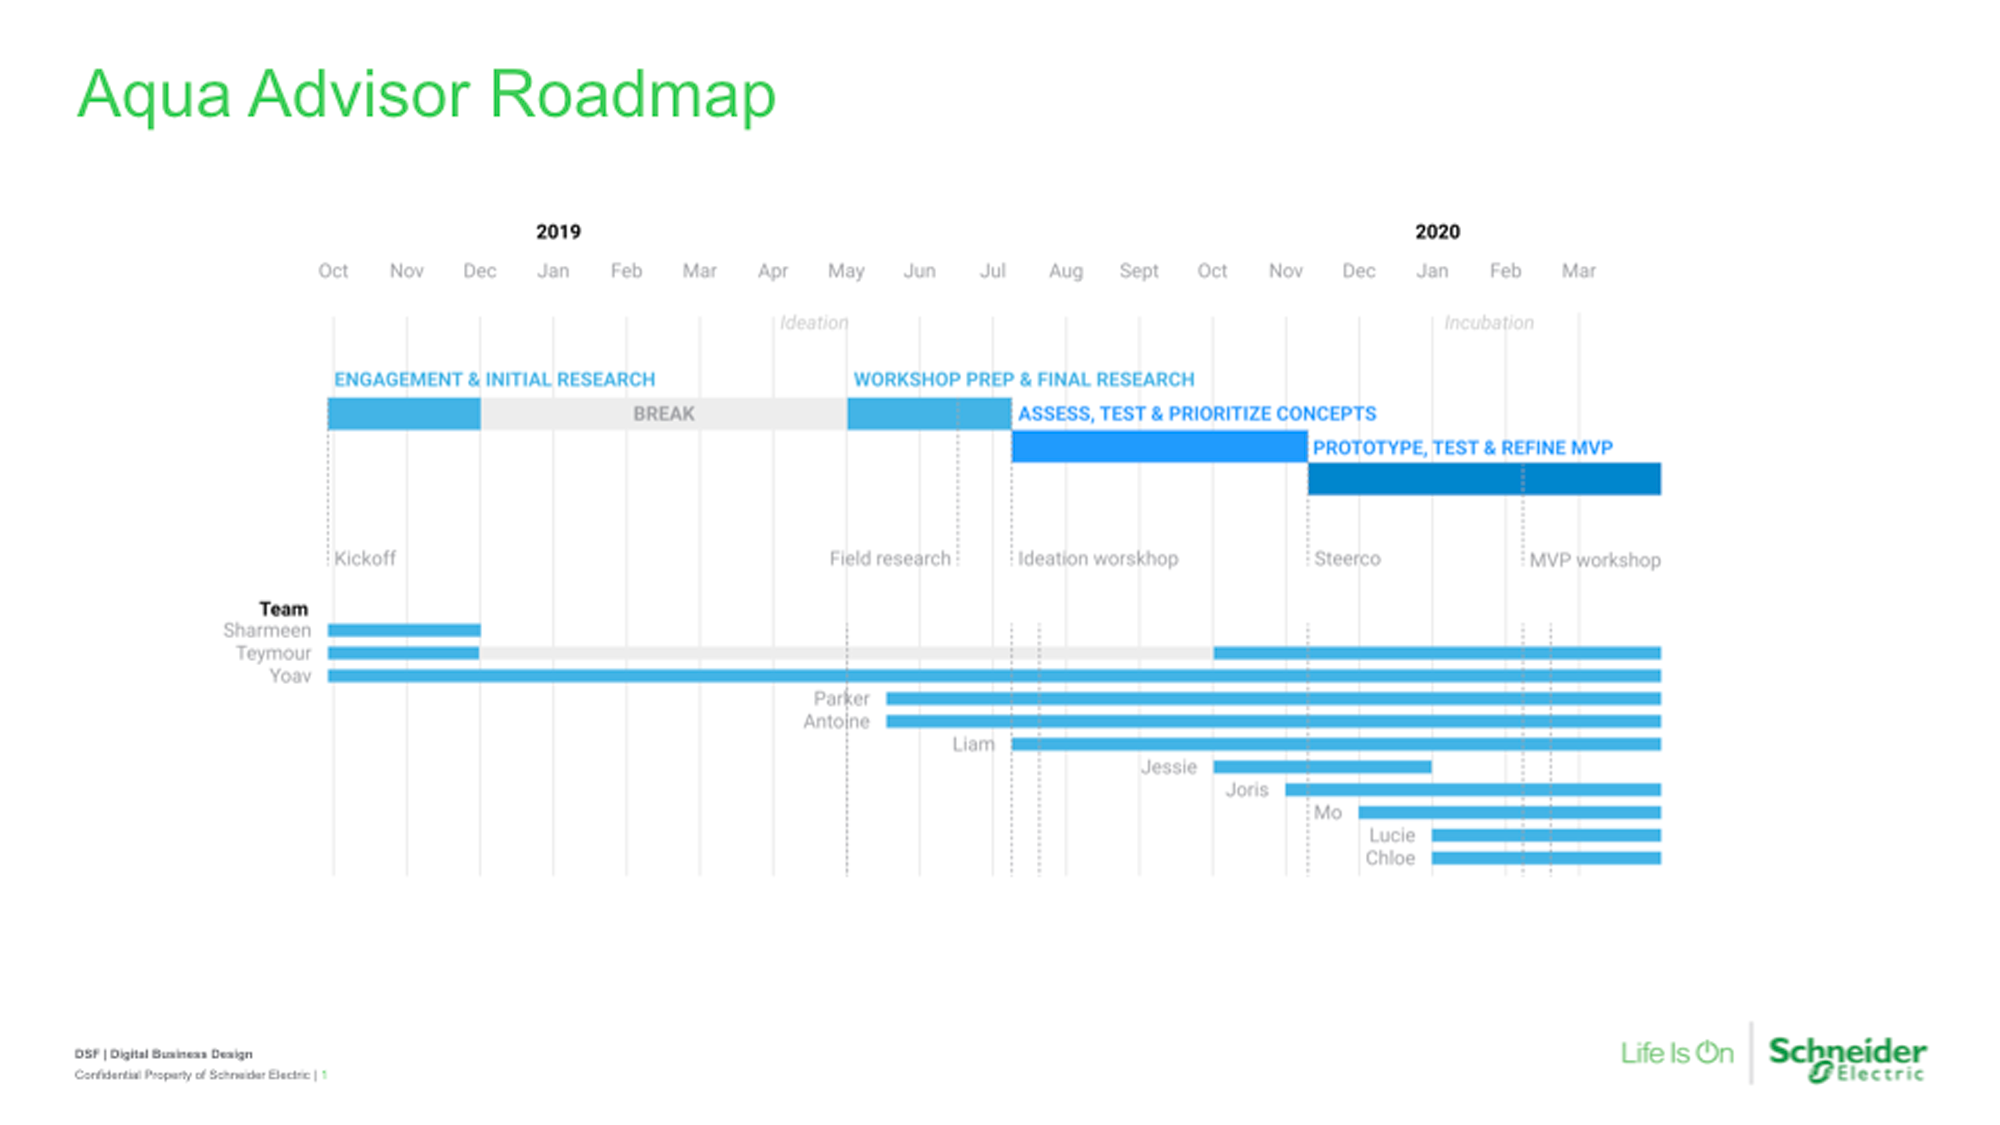
Mø led the planning for the 18-month roadmap from kickoff through field research, ideation, and prototyping to an MVP workshop, spanning a break and a cross-functional team that grew from three people to ten.
2. Research
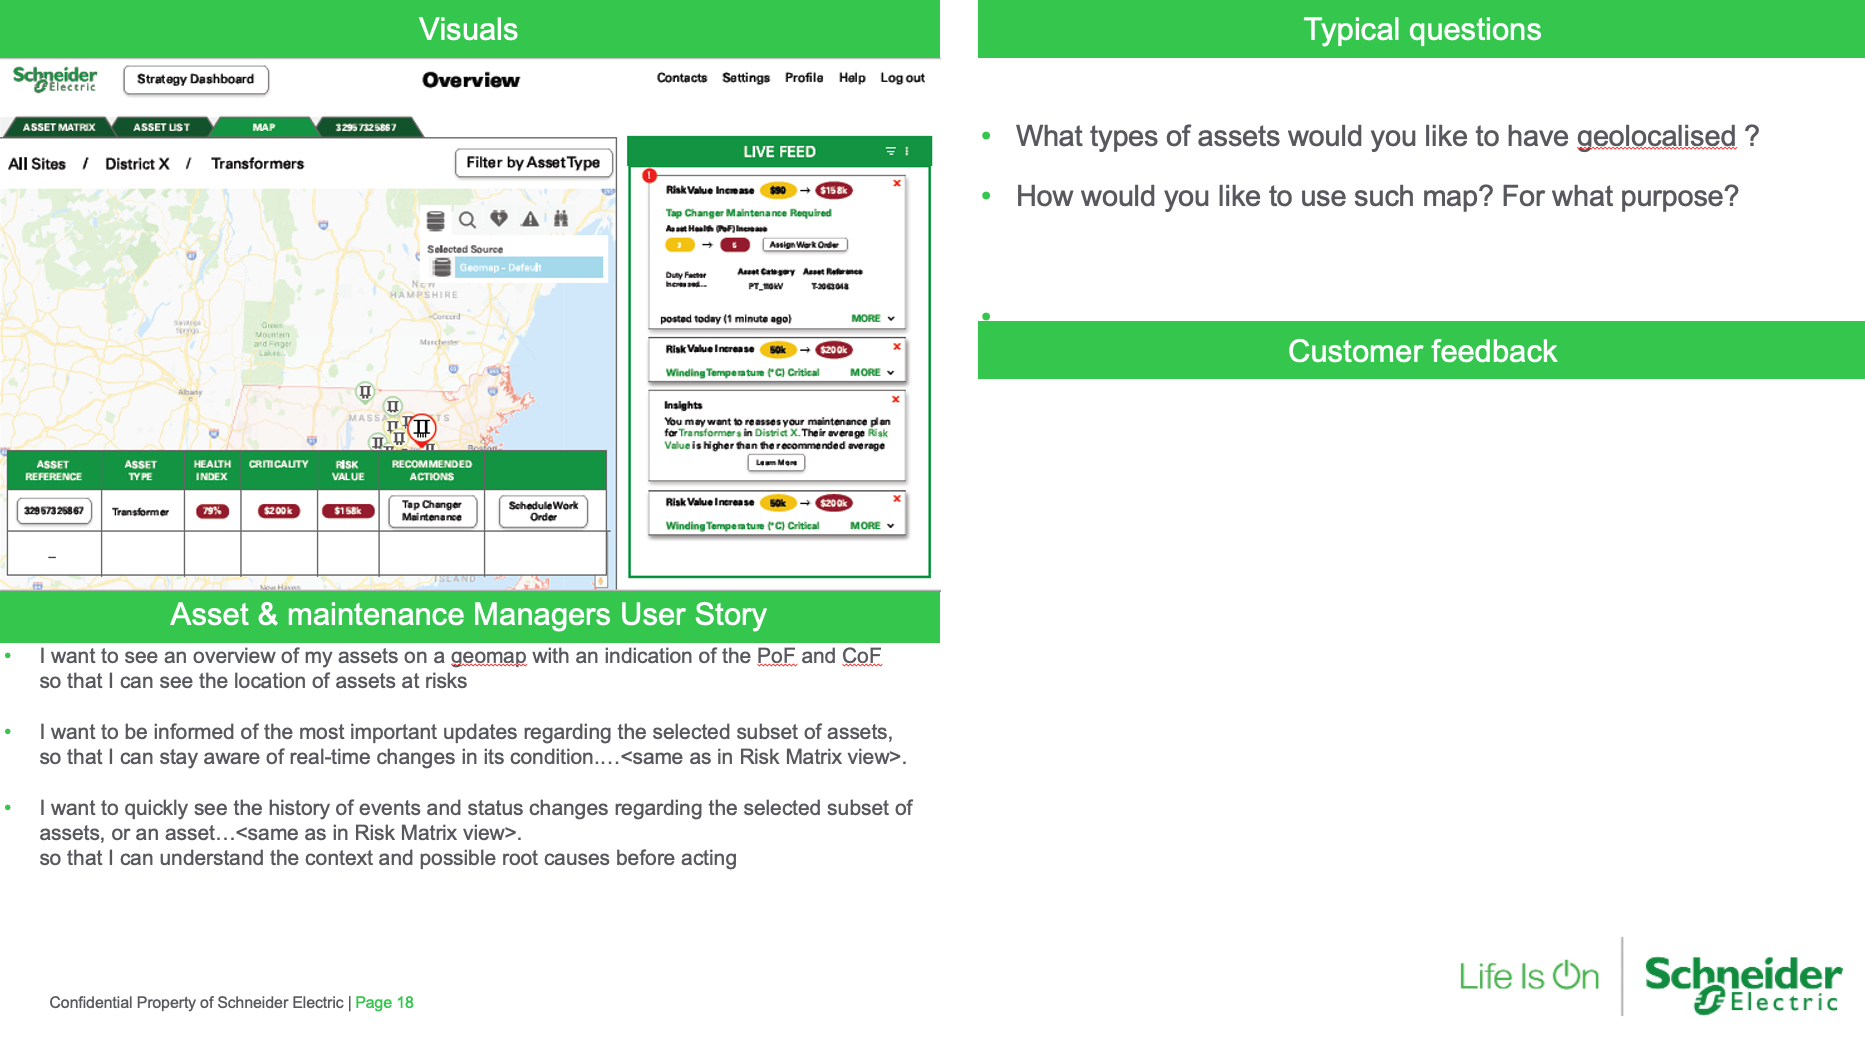
Research began by showing existing users dozens of dashboards from Schneider's products already on the market, to see which patterns they found genuinely valuable.
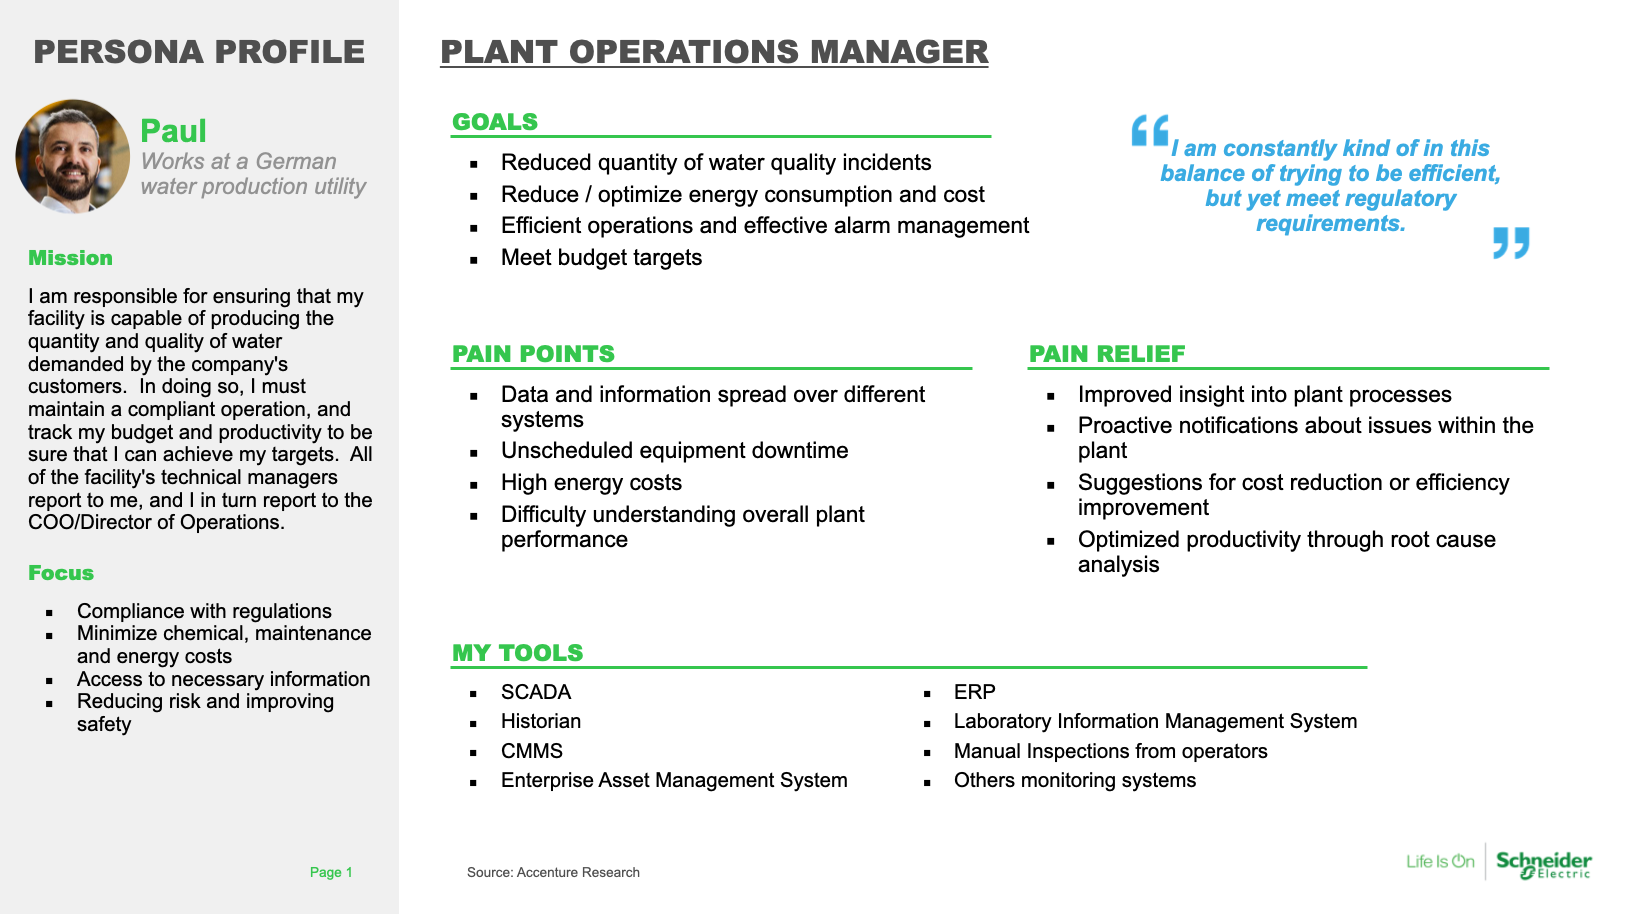
3. Personas
From the 8 principle personas in a typical water quality plant, Mø focused on 5 starting with Paul, a plant operations manager balancing compliance, cost, and uptime across disparate systems with one goal: proactive insight instead of scattered dashboards.
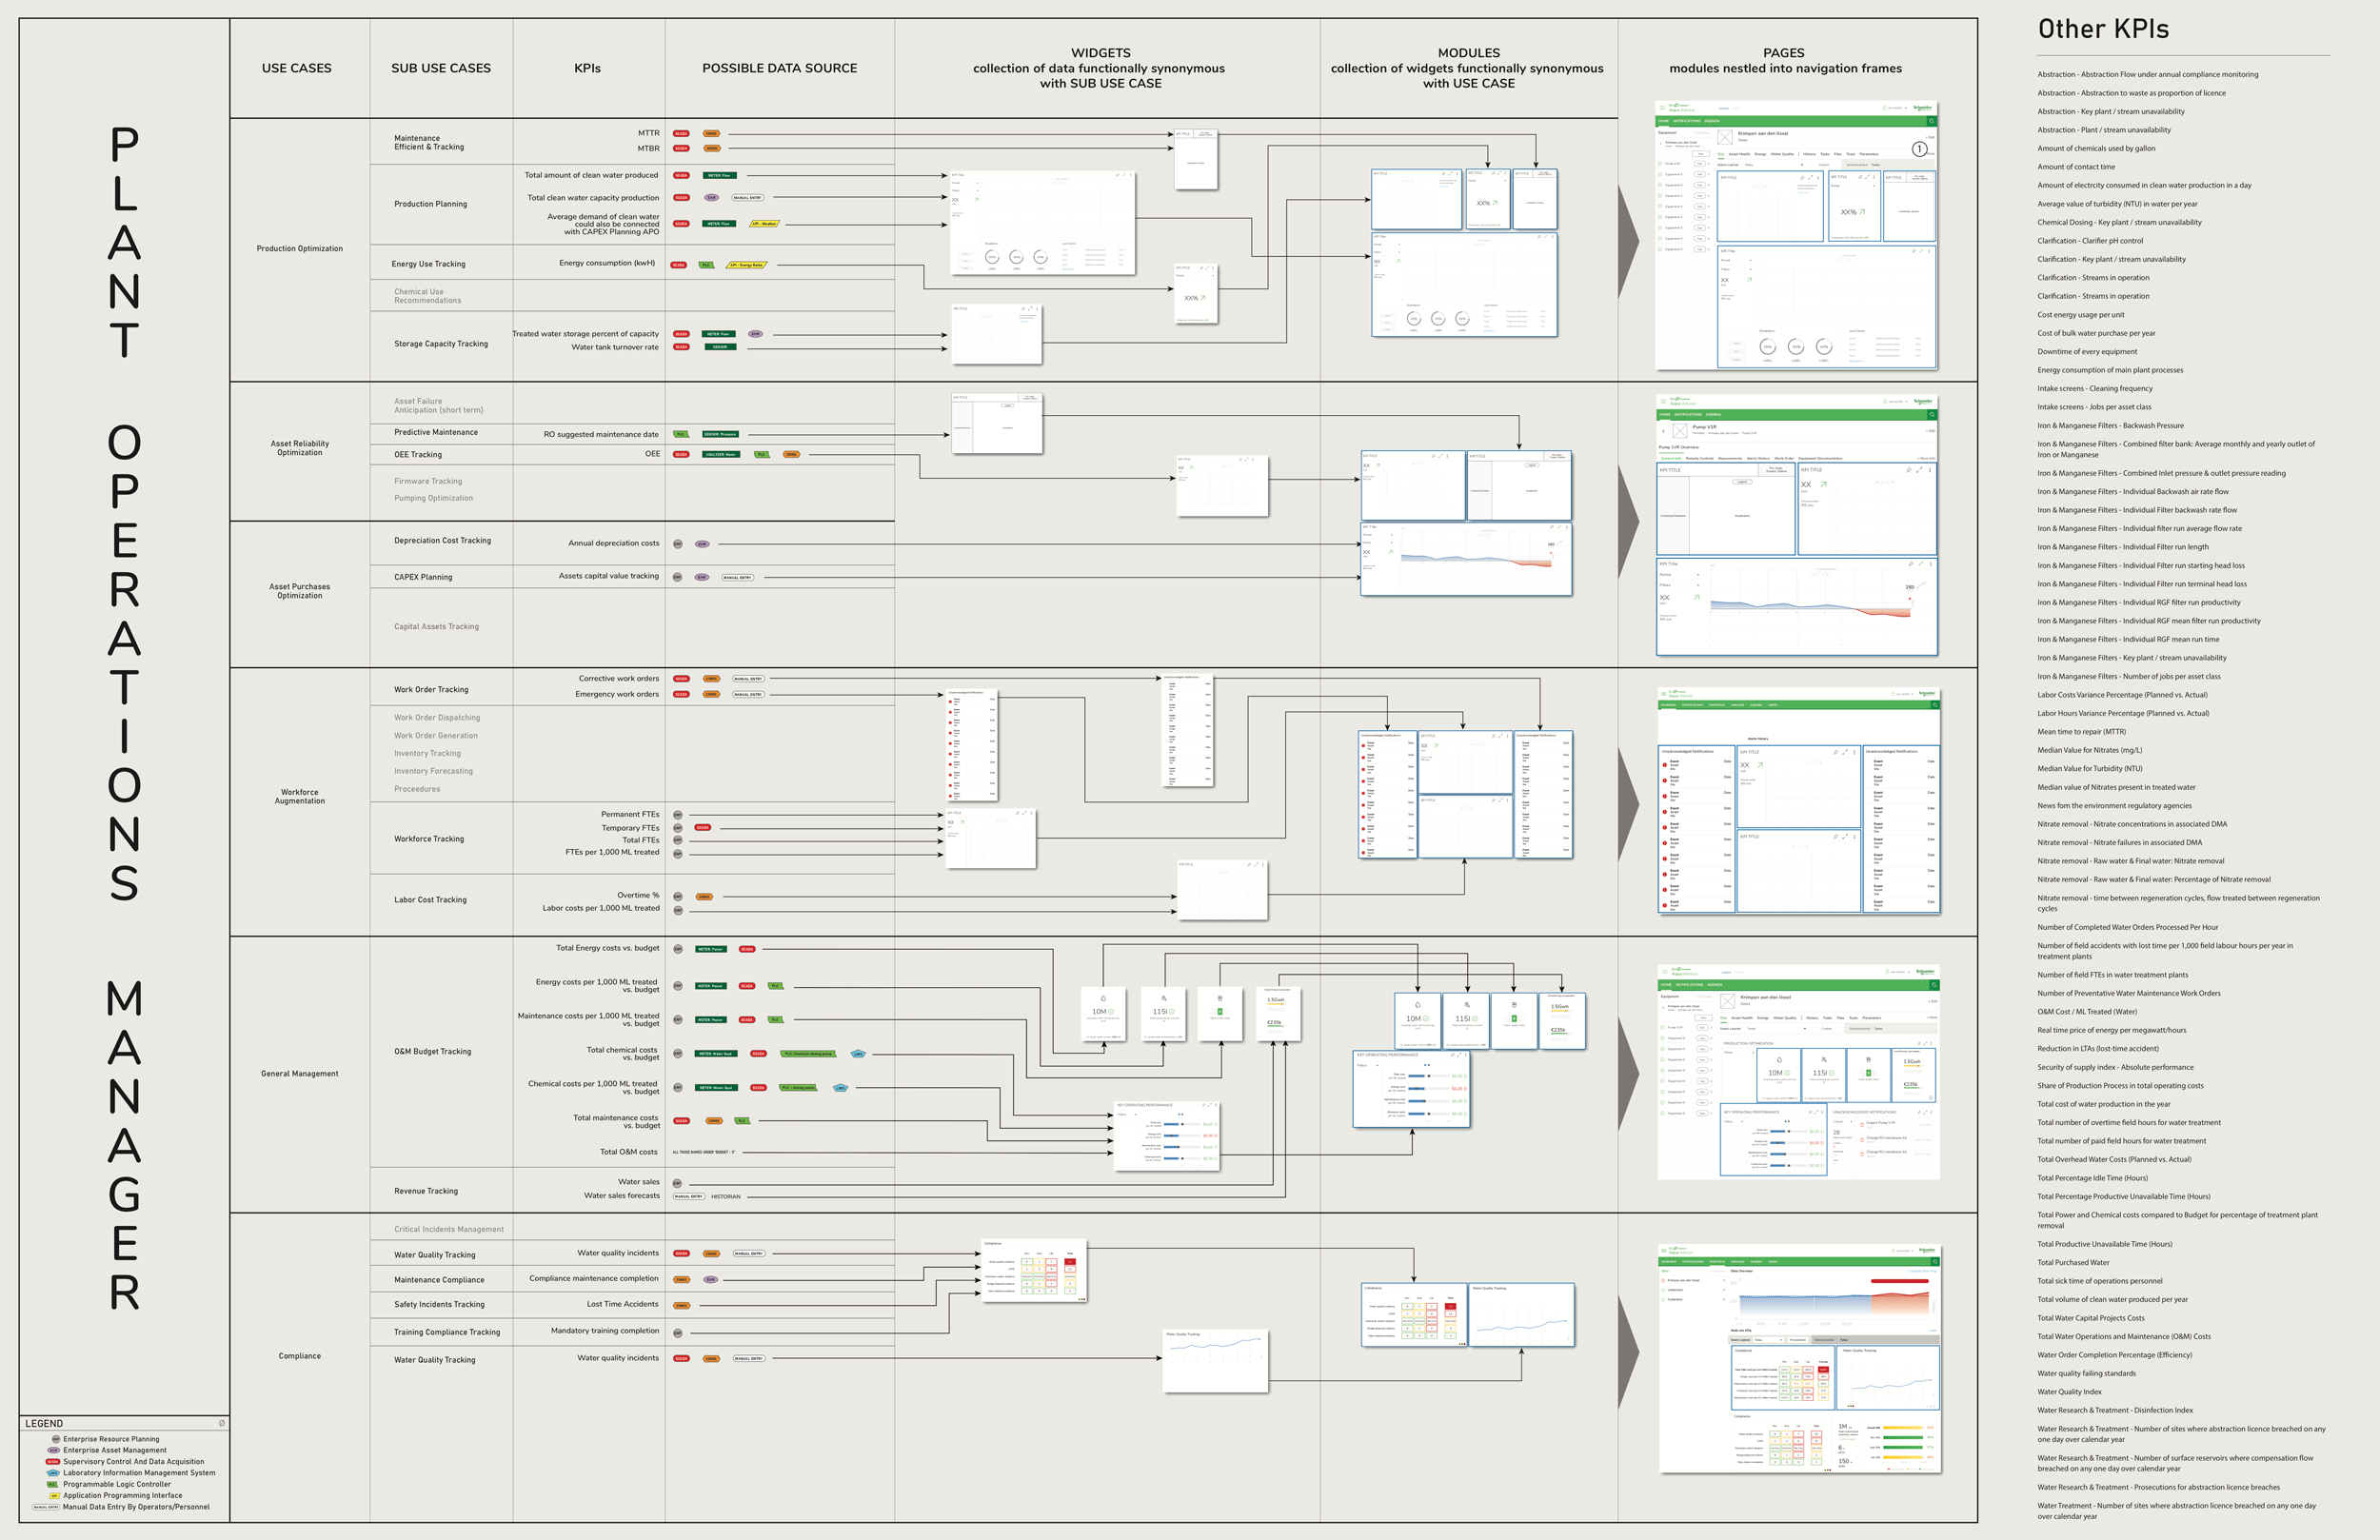
4. Information architecture
Mø traced use cases and their KPIs down to individual data sources, then back up through widgets and modules into finished pages, giving engineering and design a shared map from raw plant data to what an operator actually sees. This innovative approach to building the UX and UI was a game-changer for Schneider Electric's apps.
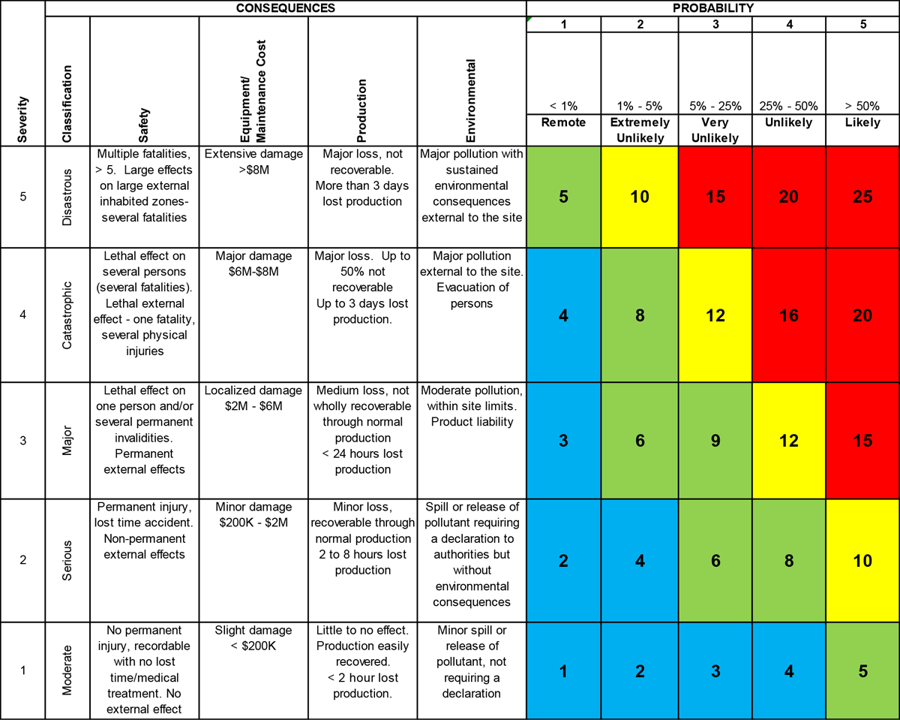
5. Giving it a brain
Working with Schneider's data scientists, Mø helped mine the company's data for what impacts asset reliability, and more importantly, the early predictors of failure. This is where Mø's cross-industry experience surfaced new ways of combining the data for insights not visible to Schneider before.
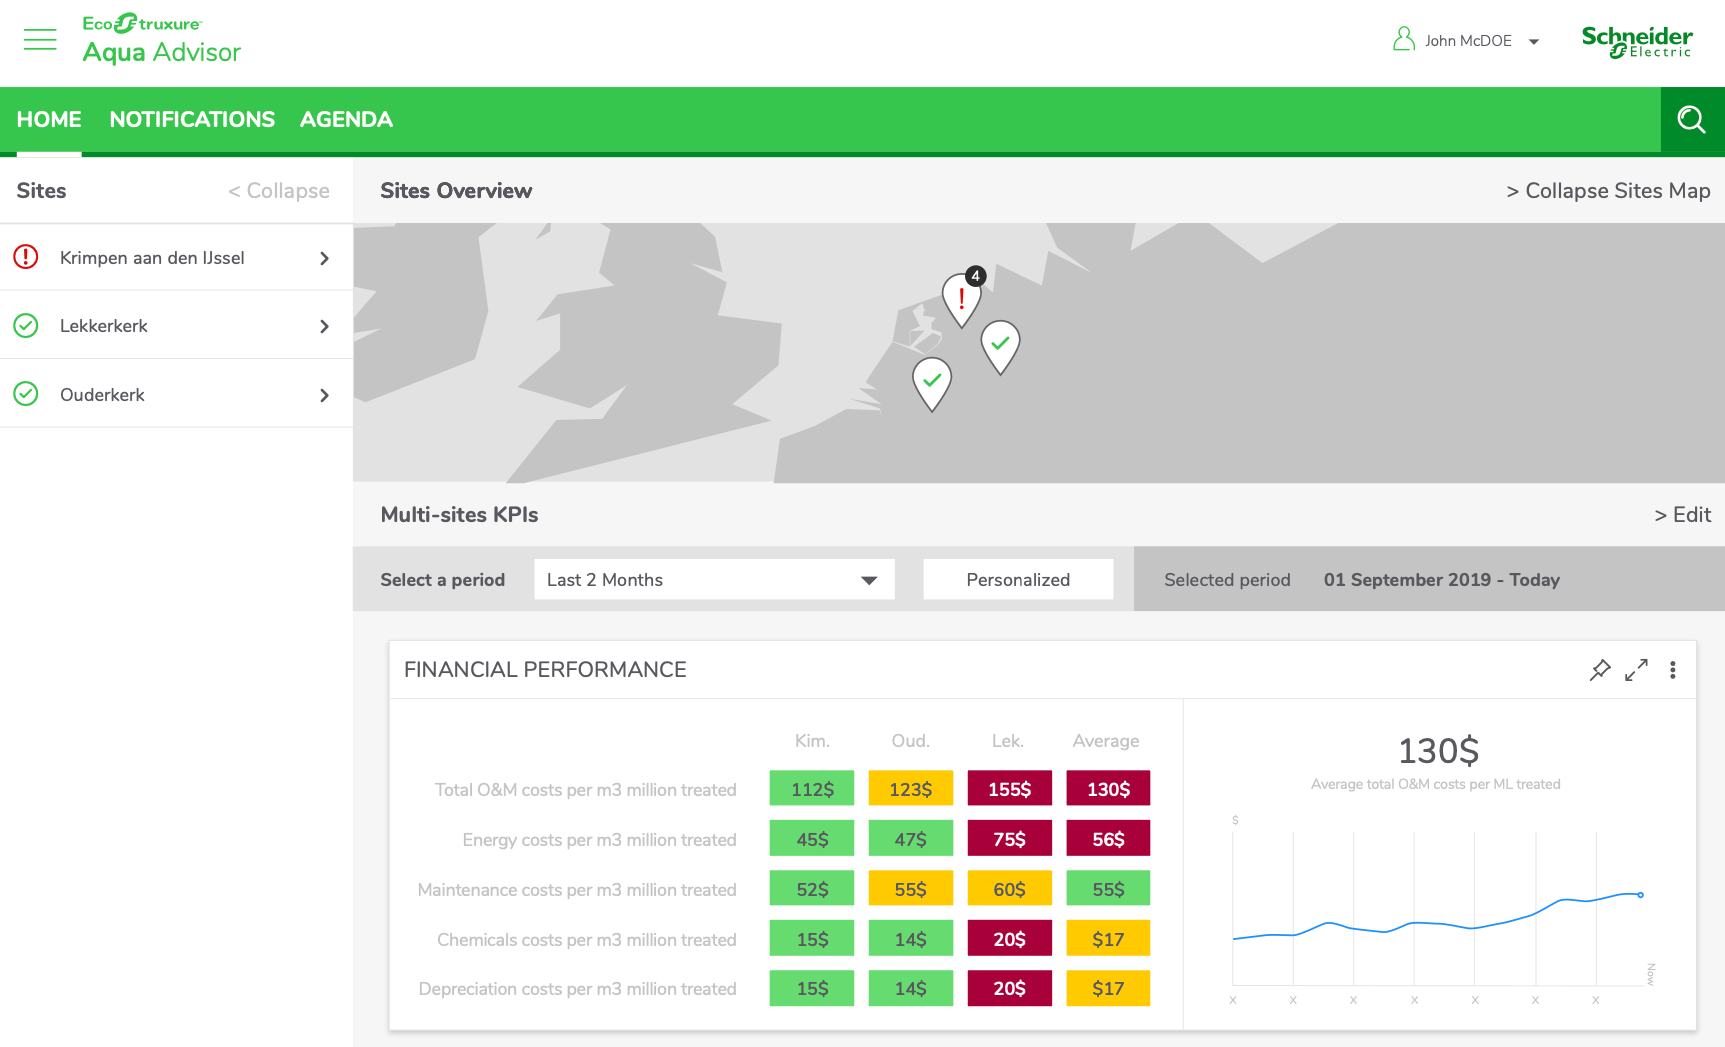
6. Final designs
The finished UX and UI was Mø's first full end-to-end project leadership effort at Schneider Electric. While the app fell victim to higher business priorities, the 6 month project secured leadership's confidence which led to his next big thing: Energy Hub.
Get in touch
Let Mø know what you're working on and what you need from design leadership or product innovation.

